
We’re delighted to bring you our February 2021 House Price Index Report. We’ve based our report on the Scottish House Price Index issued every month by the Registers of Scotland. It contains accurate date based on actual property registrations in the Land Register. Unlike lender’s property market reports, it includes properties where no mortgage is involved. There is always a slight lag of a month or so because it depends of completed registrations of property in the Land Register. We believe that it’s the most accurate report on the health of the market and that’s despite that slight lag.
The figures we’ll report on today are house price values from December 2020 registrations and October 2020 sales volumes. We’ll focus, firstly, on the figures for the whole of Scotland and then look at the local authority areas where most of our clients buy and sell their homes.
Average Price

The average price of a house in Scotland in December 2020 stood at £162,983. This is an increase of 8.4% against the same month in 2019. The average price in December 2019 was £150,287. However, the average price in December 2020 was 1.2% lower than the average price in November 2020. That being said, under supply of properties for sale has meant those properties on the market have been achieving a premium with many selling above asking price and Home Report value.
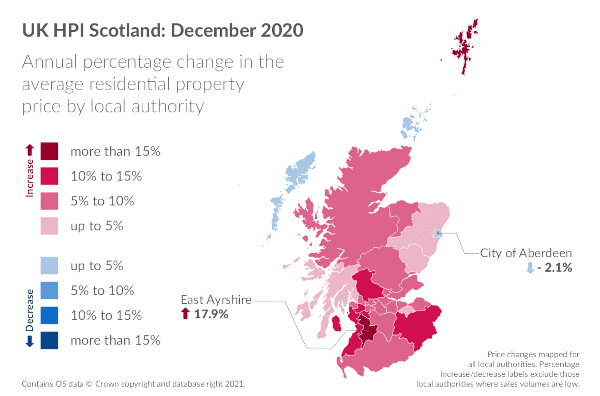
Apart from the City of Aberdeen local authority area, all other mainland local authority areas saw an increase in the average price with East Ayrshire being the largest rise for a mainland local authority area with an increase of 17.9% over December 2019.
Early indications from a local point of view show that the market continues to be busy with price increases being driven by a lack of supply of quality houses for sale. We are looking to see the supply of houses on the open market increase as spring approaches. An increased supply of available property should help even out the market.
Average price by property type
All types of property saw an increase in December against the corresponding month in 2019.
Detached property prices increased by 9.9% from £259,736 to £285,415
Semi-detached property prices increased by 8.3% from £157,001 to £169,991.
Terraced properties saw a rise of 8.9%, increasing from £125,503 to £136,679.
Finally, Flatted properties saw an increase of 7.3%, rising from £107,756 to £115,600.
Sales Volumes
Sales volumes is always a good indicator of the health of the market and gives an indication of whether the market is getting busier when compared to the previous year of getting quieter. That means sales volumes always lag the average price to ensure that they are completely reliable. There is also revisions policy in place at the Registers of Scotland and as more properties clear the registration process, the figures provided for the month will increase.
The figures contained in this report relate to the sales volumes for October 2020, the latest month for which these figures are available.
These show that the volume of properties sold in Scotland in October 2020 rose to 12,205 from 9,456 in October 2019. This is an increase of 29%. In fact volumes of sales increased in every local authority area in October 2020 when compared to the same month in 2019.
Buyer Status
In our February 2021 House Price Index Report, we are also able to bring you information on the average price paid by first-time buyers and home movers.
First time buyers paid an average price of £131,034 in December 2020.This was an increase of 7.8% over the December 2019 figure but 1.5% below the average price paid in November 2020.
Home movers paid an average price of £196,556. This was an increase of 9.2% against the figure in December 2019 but a decrease of 0.8% on the November 2020 figure.

February 2021 House Price Index Report – the local view
From a local perspective, the local authorities surrounding out office all saw decent increases in the average price in December 2020.

- Glasgow City local authority area saw an increase of 9.9% over December 2019 with the average price increasing from £136,054 to £149,565.
- North Lanarkshire local authority area saw an increase of 6.9% when compared to December 2019 rising from £108,458 to £115,933.
- South Lanarkshire local authority area saw the average price increase from £128,902 to £138,976 – a rise of 7.8%.
- East Renfrewshire local authority area saw an increase of 12.5% in the average price, rising from £152,163 to £223,209.
Local authority volumes of sales for those areas close to our offices also saw increased in October 2020.
- Glasgow City local authority area saw an increase from 1,101 to 1,333 (21%) sales.
- North Lanarkshire local authority are saw an increase from 540 to 602 (11.5%) sales.
- South Lanarkshire local authority area saw an increase from 654 to 784 (19.9%) sales, and
- East Renfrewshire local authority are saw an increase from 181 to 243 (34.3%) sales.
If you’re thinking about buying or selling and would like to discuss this with us, please complete the following form.
You may also be interested in: